Avellanes seismic station (CAVN)
Code: CA.CAVN Name: Les Avellanes Latitude: 41.8815 N Longitude: 0.7506 E Height: 634 m Local depth: - m Owner: Institut Cartogràfic i Geològic de Catalunya |
| Soil features | ||||
|---|---|---|---|---|
| Lithology | Period | Vs30 (m/s) | Classe EC8 | F0 (Hz) |
| Lutites and carniola gypsums | Triassic | 891 | E | 6.0 |
| Instrumentation by channels and periods | ||||
|---|---|---|---|---|
| Channels | Start date | Sensor type | Digitizer type | Instrumental response |
| HHZ, HHN, HHE | 01/06/1999 | Broadband velocimeter | 24 bits | [StationXML] |
Geophysical characterisation
H/V Spectral ratio from seismic noise
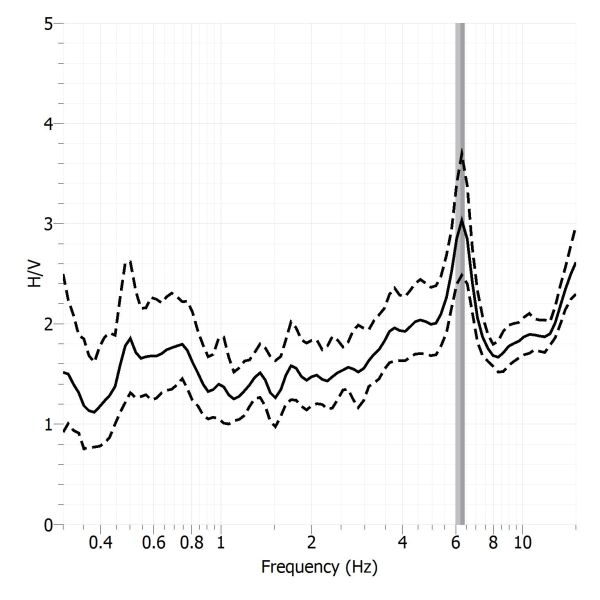
H/V Spectral ratio from seismic noise records of Les Avellanes seismic station. A peak around 6 Hz is observed which can be related to the soil fundamental frequency and, therefore, a contrast of acoustic impedance in the subsoil is expected.

H/V Spectral ratio of seismic noise records from Les Avellanes seismic station
P-waves velocity model
The P-waves velocity model, obtained by seismic tomography technique, provides information of the subsoil up to 12 meters depth. A first layer is observed, about 8 meters thick, characterized by velocities lower than 2500 m/s that is interpreted as an unconsolidated soil. The underlain layer withf higher velocities (Vp>3000 m/s) is associated with non-rippable fresh rock.

P-waves velocity model of Les Avellanes seismic station
S-waves velocity model
From the surface waves analysis (MASW) a vertical shear wave velocity profile (Vs) is retrieved. Three layers are identified: (1) a near-surface layer about 2 meters thick with a very low velocity (Vs=225 m/s) is observed, which indicates the presence of uncompacted material, related to the presence of filling material; (2) then we find a low velocity zone (Vs=650 m / s) that reaches 8 meters depth and that is interpreted as an unconsolidated soil; (3) the underlain layer is characterized by and a velocity increment (Vs>2000 m/s) that is associated with non-weathered rock.

S-waves velocity model of Les Avellanes seismic station obtained using the analysis of surface waves (MASW)
Electrical tomography
The geoelectrical model resulting after inverting the electrical resistivity (electrical tomography) shows a structure of three layers that can be related to changes in propagation velocity: (1) a first resistive layer of 2 meters thick (1000-2000 Ω·m) that correlates with the low-velocity and low-compacted stratum; (2) a second layer of medium resistivity (200-400 Ω·m) that reaches 8 meters depth and that is associated with unconsolidated soils, and finally, (3) a resistive layer is detected (500-3000 Ω·m) related to the velocity increase and interpreted as bedrock.

Surface electrical resistivity model with the location of the Les Avellanes seismic vault.